Global YouTube Usage Analysis: Top 100 Countries by User Population
CK 3386 Created at
3800
We are currently investigating global YouTube usage patterns to determine regional consumption trends and access restrictions. Among all continents, Asia leads in total usage and user numbers, primarily driven by massive markets such as India and Indonesia. On the other hand, access to YouTube remains officially blocked or strictly banned in several countries due to government censorship and geopolitical reasons, most notably in China, North Korea, Iran, Turkmenistan, and Eritrea.
1. Methodology and Selection Criteria
The ranking is compiled based on global digital audience statistics, specifically focusing on the total estimated number of YouTube users per country/territory.
Key Criteria & Data Sources
Primary Metric:YouTube Potential Advertising Reach / Active User Population (measured in millions of users). This reflects the total number of unique users reachable by ads on the platform within each specific country.
Data Sources: Consolidated data from Google Advertising Resources, DataReportal (Global Digital Reports), Statista, and ITU (International Telecommunication Union) digital infrastructure reports.
Target Audience: Includes users aged 18 and older, alongside reported general audience metrics where available (excluding platform restrictions in specific regions).
Exclusions: Countries where YouTube is officially blocked or heavily restricted by state firewalls (e.g., Mainland China, North Korea) are excluded from advertising reach rankings due to lack of verifiable data.
2. Top 100 Countries by YouTube User Population
(Note: User numbers represent estimated active reachable audience in millions. Penetration rate reflects the percentage of the total national population.)
Rank
Country
Estimated Users (Millions)
Approx. Penetration Rate (%)
1
India
462.0
32.5%
2
United States
246.0
73.1%
3
Brazil
144.0
66.8%
4
Indonesia
139.0
50.1%
5
Mexico
83.4
64.6%
6
Japan
78.4
63.2%
7
Pakistan
71.7
30.1%
8
Germany
70.9
84.8%
9
Vietnam
63.0
63.9%
10
Turkey
57.9
67.8%
11
Philippines
56.5
48.7%
12
United Kingdom
56.2
82.5%
13
Russia
54.0
37.1%
14
Egypt
45.9
41.3%
15
France
44.8
68.6%
16
South Korea
44.3
86.0%
17
Thailand
43.9
61.2%
18
Italy
43.2
73.3%
19
Nigeria
41.6
18.6%
20
Spain
40.7
85.8%
21
Bangladesh
34.4
19.8%
22
Colombia
30.4
58.6%
23
Saudi Arabia
28.1
77.2%
24
Argentina
28.0
60.9%
25
Iraq
22.8
51.3%
26
Poland
22.7
59.8%
27
Ukraine
21.4
56.3%
28
Algeria
21.3
46.8%
29
Malaysia
21.1
62.2%
30
Canada
21.0
54.3%
31
South Africa
20.8
34.4%
32
Morocco
18.2
48.3%
33
Peru
17.5
51.4%
34
Australia
17.1
65.2%
35
Taiwan
16.5
69.1%
36
Netherlands
15.1
85.0%
37
Venezuela
14.2
49.8%
38
Chile
13.8
70.3%
39
Uzbekistan
13.1
36.4%
40
United Arab Emirates
11.2
100.0%+
41
Romania
11.0
58.2%
42
Kazakhstan
10.8
54.9%
43
Ecuador
10.5
58.3%
44
Kenya
10.1
18.2%
45
Sudan
9.8
20.8%
46
Belgium
9.5
81.3%
47
Sweden
9.2
87.8%
48
Portugal
8.8
85.5%
49
Czech Republic
8.5
81.1%
50
Israel
8.3
91.2%
51
Greece
8.1
78.6%
52
Hungary
7.9
82.2%
53
Austria
7.5
83.3%
54
Switzerland
7.2
81.8%
55
Guatemala
7.0
38.8%
56
Dominican Republic
6.8
60.7%
57
Jordan
6.5
57.8%
58
Tunisia
6.3
50.8%
59
Azerbaijan
6.1
58.9%
60
Belarus
5.9
62.7%
61
Serbia
5.7
80.3%
62
Denmark
5.5
93.2%
63
Finland
5.2
93.6%
64
Norway
5.0
91.7%
65
Singapore
4.9
81.7%
66
Slovakia
4.7
86.2%
67
Bolivia
4.5
36.9%
68
Costa Rica
4.3
82.8%
69
Ireland
4.2
83.1%
70
New Zealand
4.1
79.8%
71
Oman
4.0
88.9%
72
Kuwait
3.8
88.4%
73
Lebanon
3.6
66.8%
74
Bulgaria
3.5
54.2%
75
Croatia
3.4
84.1%
76
Uruguay
3.1
89.2%
77
Panama
3.0
67.4%
78
Qatar
2.8
98.2%
79
Puerto Rico
2.7
83.1%
80
Sri Lanka
2.6
11.9%
81
Nepal
2.5
8.2%
82
Lithuania
2.4
88.0%
83
Georgia
2.3
61.3%
84
Slovenia
2.1
99.1%
85
Paraguay
2.0
29.5%
86
El Salvador
1.9
29.7%
87
Bahrain
1.8
100.0%+
88
Honduras
1.7
16.3%
89
Latvia
1.6
85.3%
90
Armenia
1.5
54.1%
91
Estonia
1.4
100.0%+ *
92
Trinidad and Tobago
1.2
78.4%
93
Cyprus
1.1
87.5%
94
Jamaica
1.0
35.2%
95
Albania
0.95
34.5%
96
North Macedonia
0.90
43.1%
97
Moldova
0.85
33.6%
98
Mongolia
0.80
23.5%
99
Luxembourg
0.55
84.6%
100
Iceland
0.32
85.3%
Note: Penetration rates exceeding 100% in countries like UAE, Bahrain, or Estonia are caused by discrepancies between official resident population censuses, non-resident worker demographics, and multiple account ownership per individual user.*
3. Key Takeaways & Geographic Trends
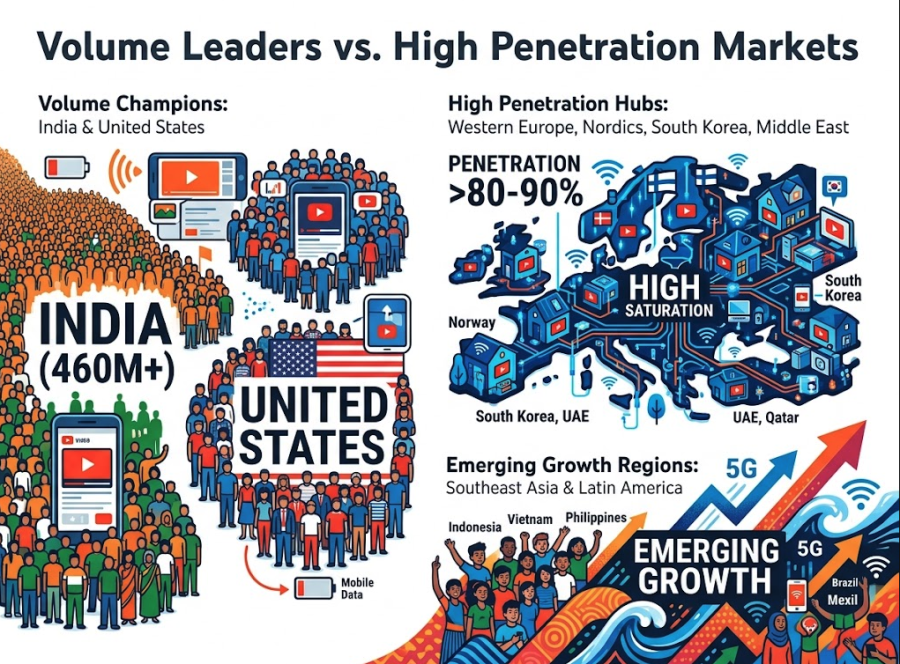
Volume Leaders vs. High Penetration Markets
Volume Champions:India and the United States represent the largest individual markets, comprising a major portion of YouTube’s global active user base. India alone accounts for over 460 million users due to low mobile data costs and massive smartphone adoption.
High Penetration Hubs: Advanced economies across Western Europe, the Nordic region (e.g., Denmark, Finland, Norway), South Korea, and parts of the Middle East (e.g., UAE, Qatar) demonstrate penetration rates above 80-90%, signaling market saturation where YouTube serves as a default utility for video consumption.
Emerging Growth Regions: Southeast Asia (Indonesia, Vietnam, Philippines) and Latin America (Brazil, Mexico) represent key growth engines, driven by young demographics and rapid mobile broadband expansion.